

Excerpt
AbstractFull-Text HTMLXML Download as PDF (Size:1032KB) PP. 23-33DOI: 10.4236/ajcc.2020.9100338 Downloads 92 Views Author(s)Leave a commentOble Neya1*, Tiga Neya2,3, Akwasi. A. Abunyewa4, Benewinde J.-B. Zoungrana1, Hypolite Tiendrebeogo5, Kangbeni Dimobe1, Joël Awouhidia Korahire6
Affiliation(s)1Competence Center, West African Science Service Center on Climate Change and Adapted Land Use (WASCAL), Ouagadougou, Burkina Faso.
2National Council for Sustainable Development, Ministry of Environment, Green Economy and Climate Change, Ouagadougou, Burkina Faso.
3Department of Civil Engineering, Kwame Nkrumah University of Sciences and Technology, Kumasi, Ghana.
4Department of Agroforestry, Kwame Nkrumah University of Sciences and Technology, Kumasi, Ghana.
5Ministry of Agriculture and hydraulic, Ouagadougou, Burkina Faso.
6Institute of Society Sciences, National Center for Scientific and Technological Research, Ouagadougou, Burkina Faso.
ABSTRACTSahel zone has been reported as one of the most vulnerable regions to climate change, so serious attention must be paid to this zone by researchers and development actors who are interested in environmental-human dynamics and interactions. The aim of this study was to bring more insight into the impact of actions aiming at reducing land degradation, regreening the Sahel, stopping population migration and reducing the pressure on land in the Sahelian zone. The study focused on farmland dynamic in Ouahigouya municipality based on remote sensing data from 1986 to 2016 using intensity analysis. The annual time interval change was 0.77% and 2.46% for 1986-2001 and 2001-2016, respectively. Farmlands gained from mixt vegetation, water bodies and from bar lands. Mixed vegetation and water bodies were both active during both intervals while the other land use such as woodland and bar land were dormant. Combining land use land cover analysis and intensity analysis was found to be effective for assessing the differentiated impact of the various land restoration actions.
KEYWORDSFarmland Dynamics, Intensity Analysis, Land Use Land Cover, Vegetation, West Africa, Climate Smart Agriculture
Cite this paperNeya, O. , Neya, T. , Abunyewa, A. , Zoungrana, B. , Tiendrebeogo, H. , Dimobe, K. and Korahire, J. (2020) Land Use Land Cover Dynamics and Farmland Intensity Analysis at Ouahigouya Municipality of Burkina Faso, West Africa. American Journal of Climate Change, 9, 23-33. doi: 10.4236/ajcc.2020.91003.
1. Introduction
In sub-Saharan Africa, where agriculture is rain-fed and characterized by smallholder farming, farmers developed several strategies to cope with low and variable productivity [1] [2] [3]. Burkina Faso is expected to face significant consequences from climate change, particularly in the Sahelian zone already characterized by scarce water resources and highly vulnerable rural populations. The impact of climate variability and change is felt so severely because livelihood and production systems are so tightly linked to the availability of rainwater particularly in the northern region where Ouahigouya municipality is located [4] [5] [6]. This municipality is known for its high level of land degradation and water scarcity leading to population migration from this zone to the southwest where land fertility and amount of rainwater are far better. The negative impact of climate variability, leading to population migration has retained the attention of decision-makers, development agents, NGO’s and researchers. Since the severe drought of 1970, climate-smart agriculture and some practices such as zai, half-moon and irrigation initiatives, have been developed particularly in the Sahelian zone [7] [8] [9].
Many studies have been done on the dynamics of protected forest areas in the country [5] [10] and on land degradation pattern in those areas, which is not the case for farmlands dynamics [11], particularly in the municipality of Ouahigouya where several land restoration actions have been implemented. A better understanding of farmlands dynamics is necessary for policymakers to forecast the impact of climate change on the livelihood of smallholder farmers in the near future. Such understanding will enable the policymakers to anticipate on appropriate adaptation and mitigation actions or strategies [11] [12]. That will contribute to avoiding population migration in search of suitable land. There is, therefore, the need to assess in this area land use land cover dynamics and farmland intensity in order to show inductive impact of various projects and update the national strategy on sustainable land management and restoration. It has been argued that, to better understand and mitigate the possible negative impacts caused by land change, it is essential to detect the trend of land change to better grasp the processes of land change [13]. Reference [14] revealed that research studies concerning land change pattern should be at least focused on why, where and when the change occurred.
This study aimed at responding to the following questions: 1) During which time intervals annual change area is relatively slow or fast? 2) Which land use categories are relatively dormant versus active ones during a given time interval? 3) Which transitions are targeted versus avoided during a given time interval in this area? This study will contribute to bringing more insight into the impact of actions aiming at reducing land degradation in the Sahelian zone.
2. Material and Method
2.1. Study Area
The study was carried out in Ouahigouya (13˚35’00 »N, 2˚25’00 »W) municipality (Figure 1). The climate of Ouahigouya is considered to be a semi-arid climate. The average annual temperature is 28.7˚C and the average annual amount of precipitation is 599 mm. The vegetation is characterized by local steppe and agricultural landscape dominated by protected species such as Vitellaria paradoxa, Parkia biglobosa, Tamarindus indica, Adansonia digitata. Breastplates and iron shells are the main soil types in this climatic zone [15].
2.2. Data Collection and Analysis
Three Landsat datasets (5, 7 and 8) from October 1986, 2001 and 2016 were downloaded from the USGS website with cloud covers less than 10% using path 195 and row 051. The time-series images were selected based on the same phenological conditions according to the climate season in the area. Analysis was performed by combining ENVI, ERDAS, and ArcGIS software based on five (05) land use land cover types, namely woodland, mixt vegetation, farmland, water body and bar land (Table 1).
Thirty random points were collected for each land use type to train and validate the classification. Image calibration of the three years was done using ground truth (survey data), archived land occupational geo-referenced points (30 in total) of each land use type of the subsequent years from available statistics (DSID, 2017: Agriculture Census statistic data) and Google Earth historical data records. Supervised classification was done using Maximum Likelihood Classifier and a post-classification technique was initiated to derive the extended cross-tabulation matrix for land use change and intensity analysis. The accuracy of image classification was 95% with a Kappa coefficient equal to 0.8. Land use land cover dynamic farmland transmission intensity, and farmland dynamic graph were derived using classified maps of 1986-2001, 2001-2016, and using the ArcGIS 10.3
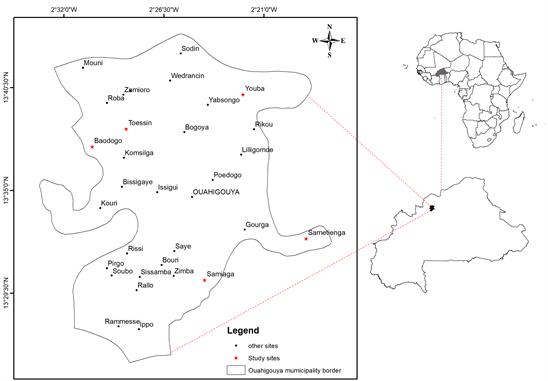
Figure 1. Ground truth data sites in Ouahigouya municipality, Burkina Faso.

Table 1. Definition of land use land cover types considered in this study.
raster calculator module. For Intensity analysis purposes, the uniform intensity line was used. For instance, if a bar chart extends above the uniform intensity line, then the category of land use land cover type is active. If a bar stops below the uniform intensity line, then the category of land use land cover type is dormant.
3. Results
3.1. Land Use Land Cover Change Dynamics
Land-cover changes analysis map (Figure 2) and statistics (Table 2) showed that both farmland and woodland proportion increased over the three points in time: 1986, 2001 and 2016 at 2.02% to 4.27% for farmland and 7.25% to 12.88% for woodland.
Mixt-vegetation and bar land increased and decreased over the period under consideration. The proportion of mixt vegetation decreased from 76.55% in 1986 to 53.11% in 2001 and increased to 76.04% in 2016. Bar land proportion increased from 13.04% up to 32.14% and decreased drastically to 5.63% in 2016 (Table 2).
3.2. Net Change Analysis of Land Use Land Cover
Land cover land use net change analysis showed a significant loss of bar land at 19.10%; 26.51% and 7.41% in 1986; 2001 and 2016, respectively. During the same period, however, the other four land use land cover types: farmland, mixt vegetation, water body and woodland showed both gains and losses (Figure 3).
3.3. Time Interval Intensity Analysis of Land-Cover/Land Use Change
The comparison of the land area changes per year with the uniform rate of the change shows that in the time interval between 2001 and 2016, the rate of land cover change was faster (2.46%) than between 1986 and 2001 (0.77%) (Table 3).
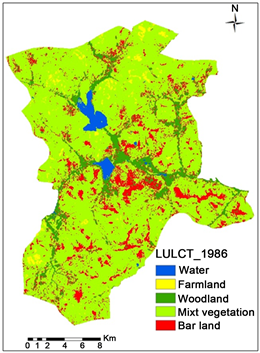
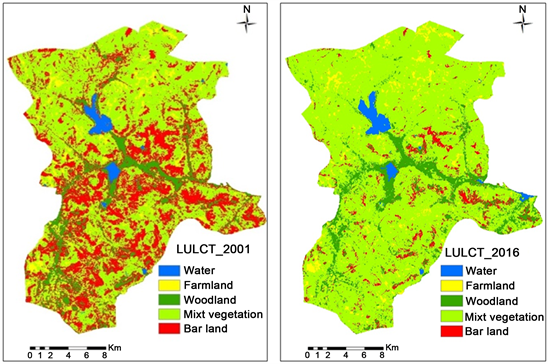
Figure 2. Land use land cover map in 1986, 2001 and 2016 in Ouahigouya Municipality, Burkina Faso.
Table 2. Area distribution of type of land change land cover in 1986, 2001 and 2016 in Ouahigouya Municipality, Burkina Faso.
(a)(b)(c)
Figure 3. Net land cover/land use changes during the periods 1986-2001 (a); 2001-2016 (b); and 1986-2016 (c) in Ouahigouya Municipality, Burkina Faso.
Table 3. Time intensity analysis of land–cover change in Ouahigouya Municipality (%).
3.4. Farmland Transmission Intensity Analysis/Agroforestry Parkland Dynamic Analysis
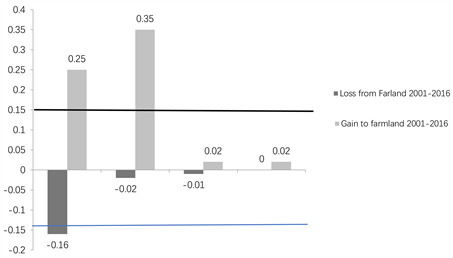
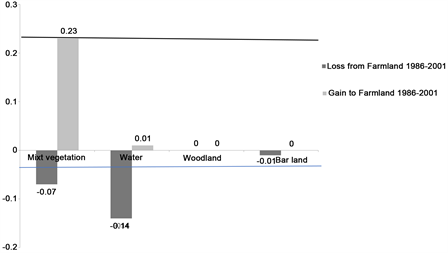
Intensity analysis showed that mixt vegetation and water body were both active during both intervals while the other land uses such as woodland and bar land were both dormant (Figure 4).
Between 1986 and 2001, only mixt vegetation was active and was significantly converted to farmland at 0.23% (Figure 4(a)). While from 2001 to 2016 farmland was gaining from four land uses, it was only water body and mixt vegetation which were more active at 0.35% and 0.25%, respectively (Figure 4(b)).
3.5. Farmland Dynamic
For both time intervals farmland was gaining more than it was losing and the net rate of gain in the time interval between 2001 and 2016 was higher (0.45%) than between 1986 and 2001 (0.02%) (Figure 5).
4. Discussion
Land use land cover dynamics revealed considerable changes over time between 1986 and 2016, although these changes were not time linear. Indeed, land use land cover change rate was higher from 2001 to 2016 compared to the period of 1986 to 2001 (Table 3). This difference in land use land cover change rate can be explained by several factors such as changes in agricultural practices, productivity instability, climate change and most particularly population growth [17]. Looking at specific land use type, net change analysis showed a loss of bar land over the three reference years, but intensity analysis revealed that the change observed was not significant to show the dynamics of this land use type. Regarding farmland, the high gain value between 2001 and 2016 could be explained by the high number of active lands uses which were converted to farmland (Figure 3(b)). Moreover, from 1986 to 2001 farmland lost to bar land at the rate of 0.01% while from 2001 to 2016 farmlands were not converted to bar land. In reverse, it was rather bar land that was converted to farmland at the rate of 0.02% (Figure 3). This conversion of bar land to farmland could be an outcome of the application of land restoration technics such Zai, half-moon, agroforestry and assisted natural regeneration activities in the Sahelian zone [7] [8] [9] [18]. As for the gain of farmland from mixt vegetation, this could be explained by the extension of farmland for food production to meet the demand of the growing population. This conversion of mixt vegetation to farmland lead to land pressure. Farmland gained from water body could be attributed to changes in agricultural practices with an
(a)(b)
Figure 4. Intensity of farmland gain (+) and loss (−) during the period 1986-2001 (a) and 2001-2016 (b). (Dark and light blue lines are uniform intensities of gain and loss, respectively in Ouahigouya municipality. Bars that extend above line indicate the land cover targeted for transition, and bars below line indicate avoided land cover).
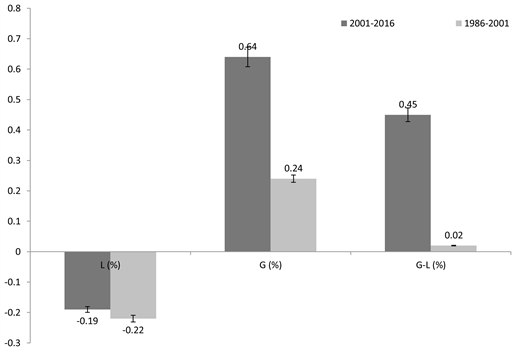
Figure 5. Farmland dynamic from 1986 to 2001 and from 2001 to 2016 in Ouahigouya municipality (G: gain, L: loss and G – L: net gain).
increase in irrigated areas in the last decade to promote vegetable and rice production in the Sahel zone. Some authors argued that the combination of political, social and economic events encouraged changes in farming systems and land use [19] [20] [21]. Indeed, in the study area lowland planning and conversion into irrigated farmland to promote vegetable and crop production during both raining and dry seasons have been actively supported by the government as well as some projects and NGOs. The loss of bar land to farmland as well as the conversion of lowlands to farmland increase biomass production in the Sahelian zone. This finding corroborates the results of previous works which reported a re-greening of the Sahel [10] [22].
5. Conclusion
The study revealed that farmland and woodland proportion increased over the three points in time: 1986, 2001 and 2016 at 2.02% to 4.27% for farmland and 7.25% to 12.88% for woodland. Annual land use land cover change during 2001-2016 was faster than that during 1986-2001. The net change analysis showed a significant loss of bar land at 19.10%; 26.51% and 7.41% in 1986; 2001 and 2016, respectively Indeed, the study showed that mixt vegetation and water body were both active during the period of study at 0.35% and 0.25%, respectively while the other land uses such as woodland and bar land were dormant. For time intervals used, farmland was gaining more than it was losing and the net rate of gain in the time interval between 2001 and 2016 was higher (0.45%) than that between 1986 and 2001 (0.02%).
Acknowledgements
The authors wish to express their profound gratitude to Ouahigouya Municipality farmers for their collaborations and openness. They are also grateful to field assistants and to Hypolite Tiendreobeogo for their valuable assistance during the fieldwork. They acknowledge the anonymous reviewers for their valuable inputs and comments which improve the quality of this paper. A special thanks to WASCAL for the funding of this research.
Conflicts of Interest
The authors declare no conflicts of interest regarding the publication of this paper.
References
| [1] | Mertz, O., Mbow, C., Reenberg, A. and Diouf, A. (2009) Farmer’s Perceptions of Climate Change and Agricultural Strategies in Rural Sahel. Journal of Environmental Management, 4, 804-816. https://doi.org/10.1007/s00267-008-9197-0 |
| [2] | Nhemachena, C. (2009) Agriculture and Future Climate Dynamics in Africa: Impacts and Adaptation Options. Ph.D. Thesis, Department of Agricultural Economics, Extension, and Rural Development, University of Pretoria, South Africa, 124 p. |
| [3] | Pouliotte, J., Smit, B. and Westerhoff, L. (2009) Adaptation and Development: Livelihoods and Climate Change in Subarnabad, Bangladesh. Climate Change and Development, 1, 31-46. https://doi.org/10.3763/cdev.2009.0001 |
| [4] | Djiri, D., Honadia, M., Yaméogo, U. and Doulkom, A. (2011) Forest Investment Program: Investment Strategy, Draft 1. Ministry of Environment and Livelihoods (MECV), Ouagadougou, Burkina Faso. |
| [5] | Marie, B., Nacoulma, I., Schumann, K. and Bernhardtro, M. (2011) Impacts of Land-Use on West African Savanna Vegetation: A Comparison between Protected and Communal Area in Burkina Faso. Biodiversity and Conservation, 20, 3341-3362. https://doi.org/10.1007/s10531-011-0114-0 |
| [6] | MEDD (2014) Adapting Natural Resource Dependent Livelihoods to Climate Induced Risks in Selected Landscapes in Burkina Faso: The Boucles du Mouhoun Forest Corridor and the Mare d’Oursi Wetlands Basin. 173 p. |
| [7] | Barro, A., Zougmoré, R. and Taonda, S.J.B. (2005) Mécanisation de la technique du zaï manuel en zone semi-aride. Cahiers Agricultures, 14, 549-559. |
| [8] | Zougmoré, R., Mando, A. and Stroosnijder, L. (2009) Soil Nutrient and Sediment Loss as Affected by Erosion Barriers and Nutrient Source in Semi-Arid Burkina Faso. Arid Land Research & Management, 23, 85-101. https://doi.org/10.1080/15324980802599142 |
| [9] | Kogachi, A. and Shaw, J. (2012) Chapter 18 Experience of Community-Based Adaptation in Burkina Faso. In: Shaw, R., Ed., Community-Based Disaster Risk Reduction (Community, Environment and Disaster Risk Management, Volume 10), Emerald Group Publishing Limited, London, 351-371. https://doi.org/10.1108/S2040-7262(2012)0000010024 |
| [10] | Ouedraogo, I., Runge, J., Eisenberg, J., Barron, J. and Kaboré, S.S. (2014) The Re-Greening of the Sahel: Natural Cyclicity or Human-Induced Change? Land, 3, 1075-1090. https://doi.org/10.3390/land3031075 |
| [11] | Lambin, E. and Meyfroidt, P. (2011) Global Land Use Change, Economic Globalization, and the Looming Land Scarcity. Proceedings of the National Academy of Sciences of the United States of America, 108, 3465-3472. https://doi.org/10.1073/pnas.1100480108 |
| [12] | Neya, T., Daboue, E., Neya, O., Ouedraogo, I. and Sena, K.Y. (2017) Tolerance à la dessiccation des semences de Parinari curatellifolia planch. ex benth, Vitex doniana sweet et Zanthoxylum zanthoxyloides ( lam ) watermann au Burkina Faso Desiccation tolerance of Parinari curatellifolia planch . ex benth, Vitex doniana Sweet and Zanthoxylum zanthoxyloides ( lam ) watermann, ijbcs 11 December, 2730-2744. https://doi.org/10.4314/ijbcs.v11i6.14 |
| [13] | Villamor, G.B., Secondary, C.A., Author, C., Villamor, G.B., Pontius, R.G., Noordwijk, M. and Villamor, G.B. (2005) Regional Environmental Change Agroforest’ s Growing Role in Carbon Losses from Jambi (Sumatra), Indonesia. |
| [14] | Lambin, E. (1997) Modelling and Monitoring Land-Cover Change Processes in Tropical Regions. Progress in Physical Geography, 21, 375-393. https://doi.org/10.1177/030913339702100303 |
| [15] | Bunasols (1992) Etude pédologique des provinces du Yatenga et du Passoré. Ouagadougou, 46 p. |
| [16] | FAO (2015) Global Forest Resources Assessment. https://www.fao.org/3/a-i4808e |
| [17] | INSD (Institut National des Statistiques et de la Démographie) (2006) Recensement général de la population et de l’habitation. Rapport de recensement. 176 p. |
| [18] | Barbier, E.B. (2000) The Economic Linkages between Rural Poverty and Land Degradation: Some Evidence from Africa. Agriculture, Ecosystems & Environment, 82, 355-370. https://doi.org/10.1016/S0167-8809(00)00237-1 |
| [19] | Geissler, C. and Penot, E. (2000) Mon palmier à huile contre ta forêt déforestation et politiques de concessions chez les Dayaks, Ouest-Kalimantan, Indonésie. Bois et Forêts des tropiques, 266, 7-22. |
| [20] | Penot, E. (2004) Risk Assessment through Farming Systems Modeling to Improve Farmers’ Decision-Making Process in a World of Uncertainty. Acta Geographica Sinica, 9, 33-50. |
| [21] | Yuan, F., Sawaya, K.E., Loeffelholz, B.C. and Bauer, M.E. (2005) Land Cover Classification and Change Analysis of the Twin Cities (Minnesota) Metropolitan Area by Multitemporal Landsat. Remote Sensing, 98, 317-328. https://doi.org/10.1016/j.rse.2005.08.006 |
| [22] | Michetti, M. and Zampieri, M. (2014) Climate-Human-Land Interactions: A Review of Major Modelling Approaches. Land, 3, 793-833. https://doi.org/10.3390/land3030793 |